

When I was running Plex, Tautulli sat quietly in the background doing one thing I actually cared about: telling me what I'd watched and how much time I'd spent on it. I had no use for its notification system or custom script execution. I just wanted the numbers. The graphs. The "oh, I watched 40 hours of this show last month" kind of accountability.
Tautulli was good at that. You'd log in, see your homepage stats, filter by time range, check your user page, and walk away knowing exactly which shows were eating your free time.
Then you migrate to Jellyfin. Tautulli stops working because it only speaks Plex. Jellyfin doesn't have a built-in equivalent. You're suddenly flying blind.
Enter Streamystats.
The Core Trade
Tautulli and Streamystats both answer the same basic question: what have I been watching? But they arrive at the answer through completely different lenses.
Tautulli is a Python-based monitoring tool that tracks what was watched, who watched it, when and where, with detailed statistics about each library and user. The interface is functional, organized by discrete views (Users, Libraries, History, Graphs). Everything is there. Nothing is flashy.
Streamystats is built with modern frameworks and includes a dashboard with overview statistics, live sessions, recommendations, and an interactive AI chat interface. The data architecture is newer. The UI feels more intentional. You're not clicking through separate tabs to find what you want; you're asking the dashboard what you want to know.
Here's the practical difference: Tautulli made you navigate. Streamystats makes you browse.
Side by Side
| Feature | Tautulli | Streamystats |
|---|---|---|
| Current activity monitoring | Yes | Yes |
| Watch history with search | Yes | Yes |
| User statistics | Yes | Yes |
| Library statistics | Yes | Yes |
| Device/IP tracking | Yes | Yes |
| Graphing & trends | Highcharts (rich) | Modern dashboard (focused) |
| Notifications (Discord, Slack, email, etc.) | Extensive | No |
| Custom scripting | Yes | No |
| AI recommendations | No | Yes (semantic) |
| AI chat query | No | Yes |
| Custom watchlists | No | Yes |
| Semantic search | No | Yes (with embeddings) |
| Watch pattern heatmaps | No | Yes |
| No plugin requirement | No (requires API access) | Yes (Jellyfin API only) |
| Tech stack | Python | Next.js / React / TypeScript |
| Active development | Maintenance | Active hobby project |
The rows that matter depend on what you actually use. I skipped notifications and scripting entirely. The loss is immaterial to me. I gained better graphs, a nicer interface, and a completely new capability I didn't have before: AI-driven insights.
What Changed in Practice
Tautulli's homepage gave you four key boxes: your top items this week, your top users, recent activity, your watch time by duration. Clean. Minimal. You look, you go.
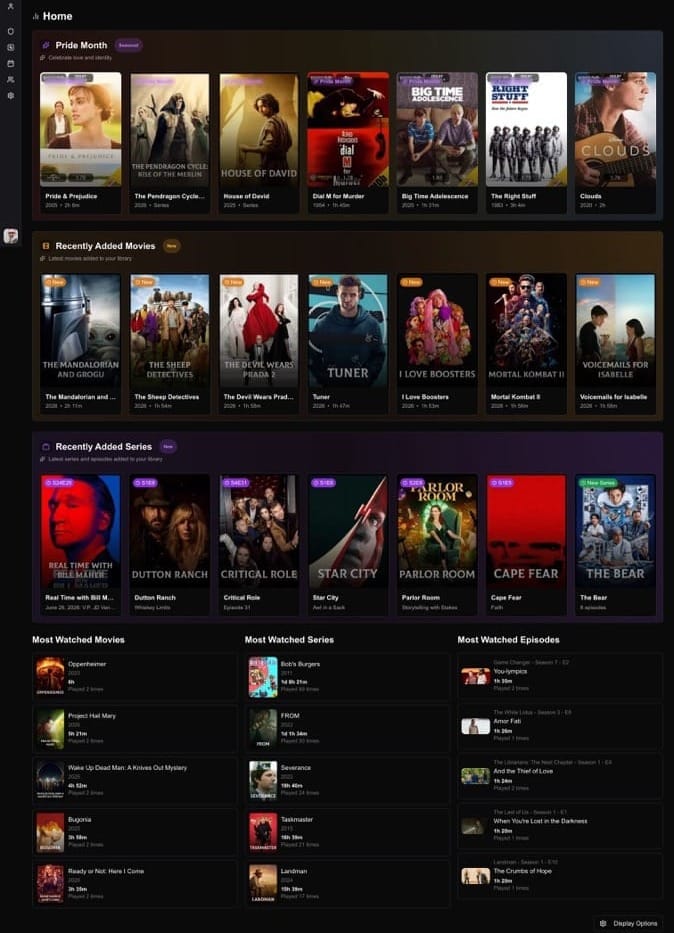
Streamystats' dashboard is denser. It defaults to showing you live sessions (who's watching right now), recent activity, trending content, and recommendations. Scroll down and you get genre breakdowns, watch time graphs, and completion rates. It's a different philosophy. Instead of answering "what was I doing," it's showing you "what's happening now and what should you notice."
The real shift comes in the user pages.
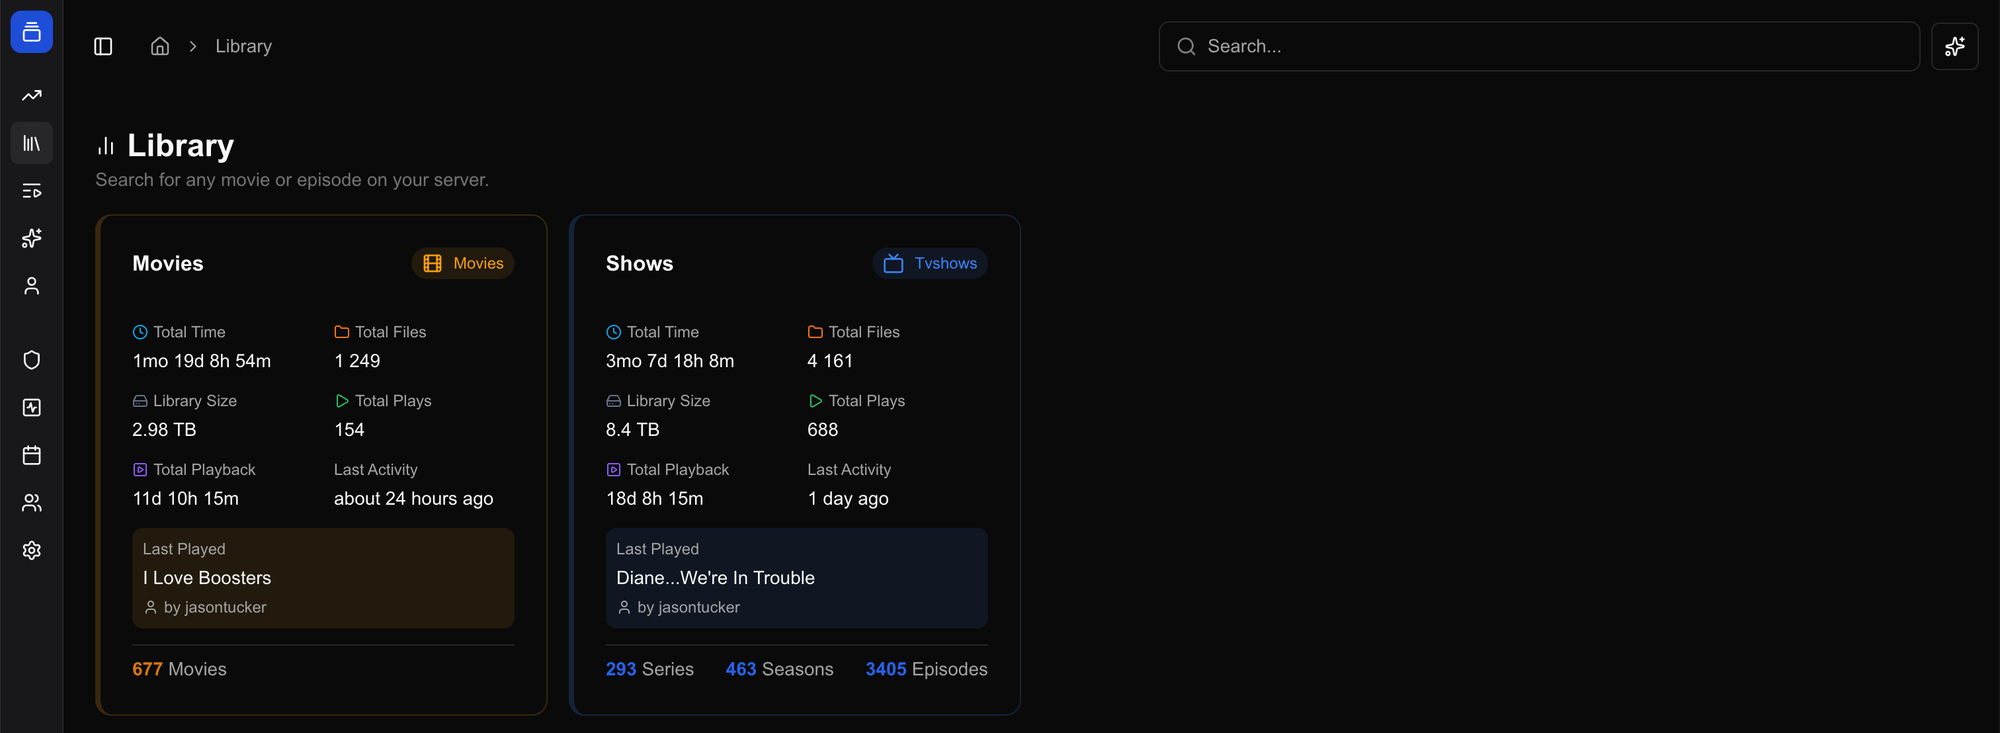
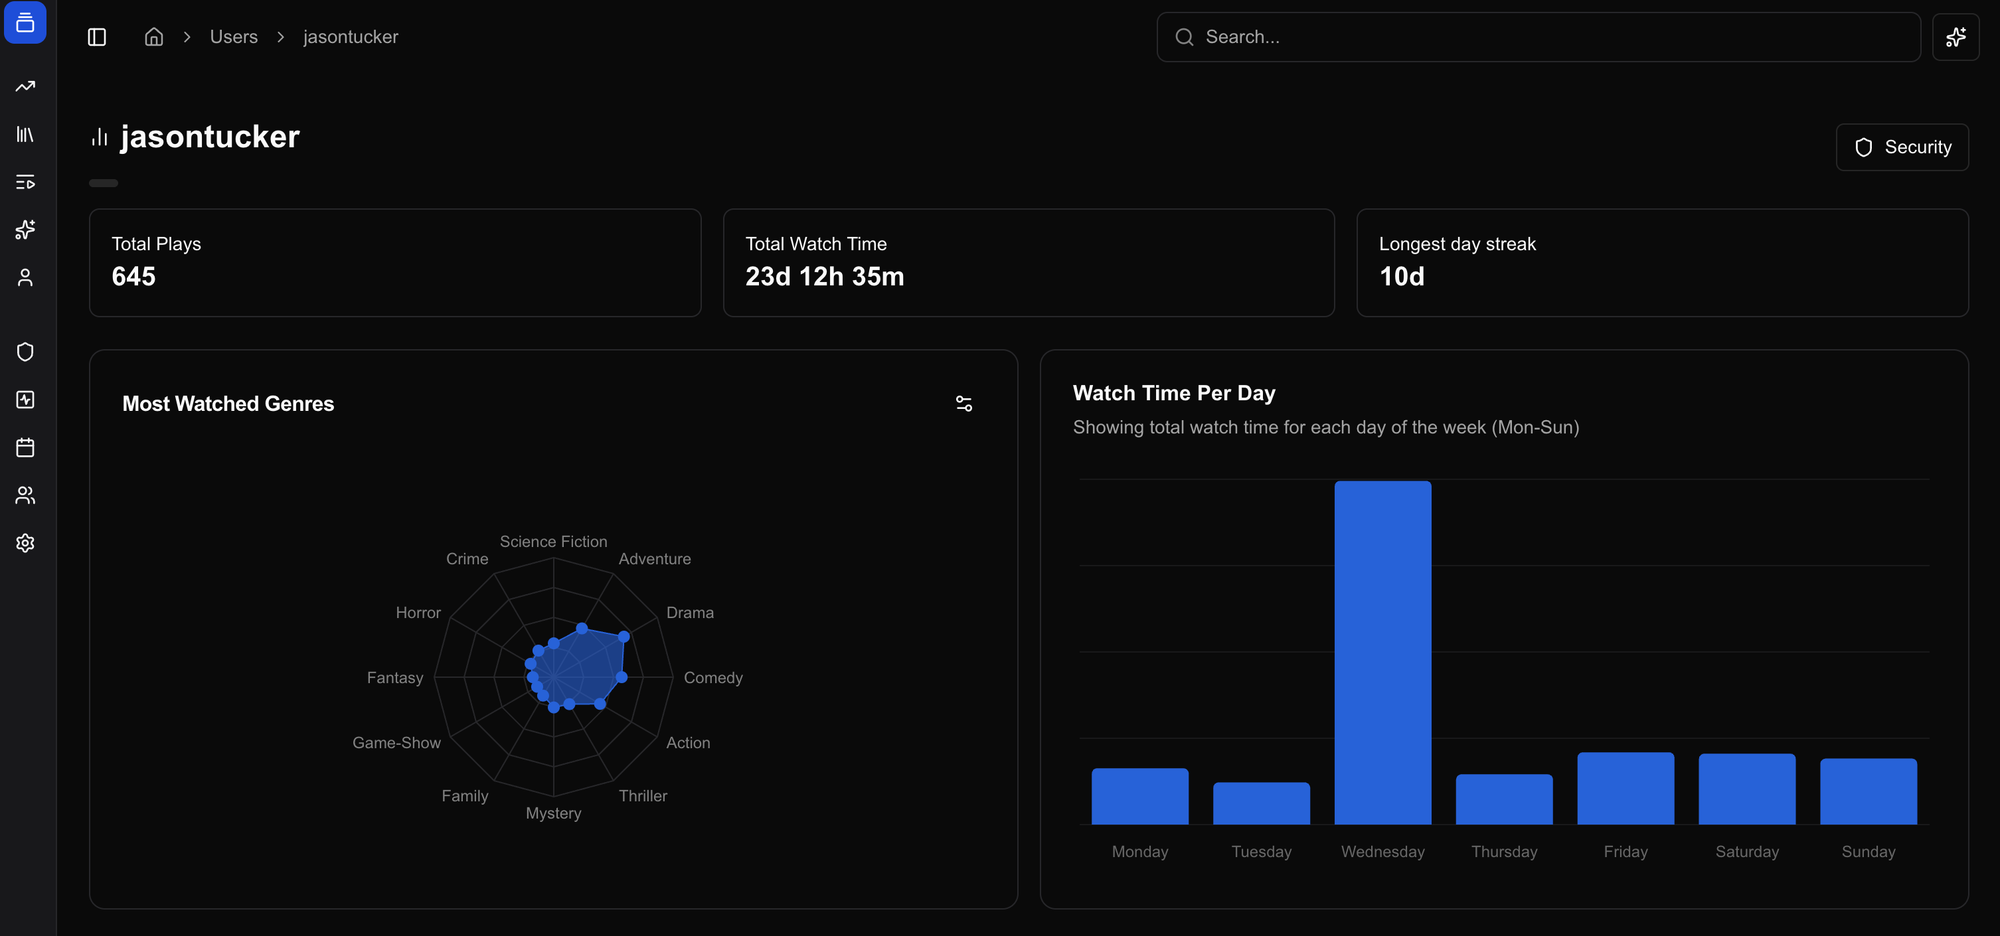
Your own user page in Streamystats shows your personal watch history with filters (date range, library, media type), time spent watching by date, watch frequency, top items, and now, heatmaps showing when you watch and how much. You can drill into any show and see your episode progression. You can see which users share your watching taste.
That last one didn't exist in Tautulli. Not in any meaningful way.
New Capabilities You Didn't Have Before
Streamystats added four things that fundamentally change how you interact with your library.
Watchlists. You can create custom lists in the interface. Mark items as watched or unwatched. Set them public or private. Flag them as "promoted" so they show up as sections in your Jellyfin clients. This wasn't Tautulli's job. This was Radarr/Sonarr territory. Streamystats treats it as a first-class feature. This isnt something that I use since I have other tools doing this but its interesting.
Semantic search and AI chat. If you enable OpenAI-compatible API access (OpenAl,Together Al, Fireworks Al, Voyage Al, OpenRouter, Ollama (Local), LM Studio (Local), LocalAl (Local), Custom) Streamystats can embed your library and answer questions about it. "Show me all the sci-fi I've started but haven't finished." "What should I watch based on what I liked last month?" The backend uses vectorchord to store embeddings and performs fuzzy similarity search. It's genuinely useful if you have a large library and a fuzzy memory of what you own. I've messed with this a bit.
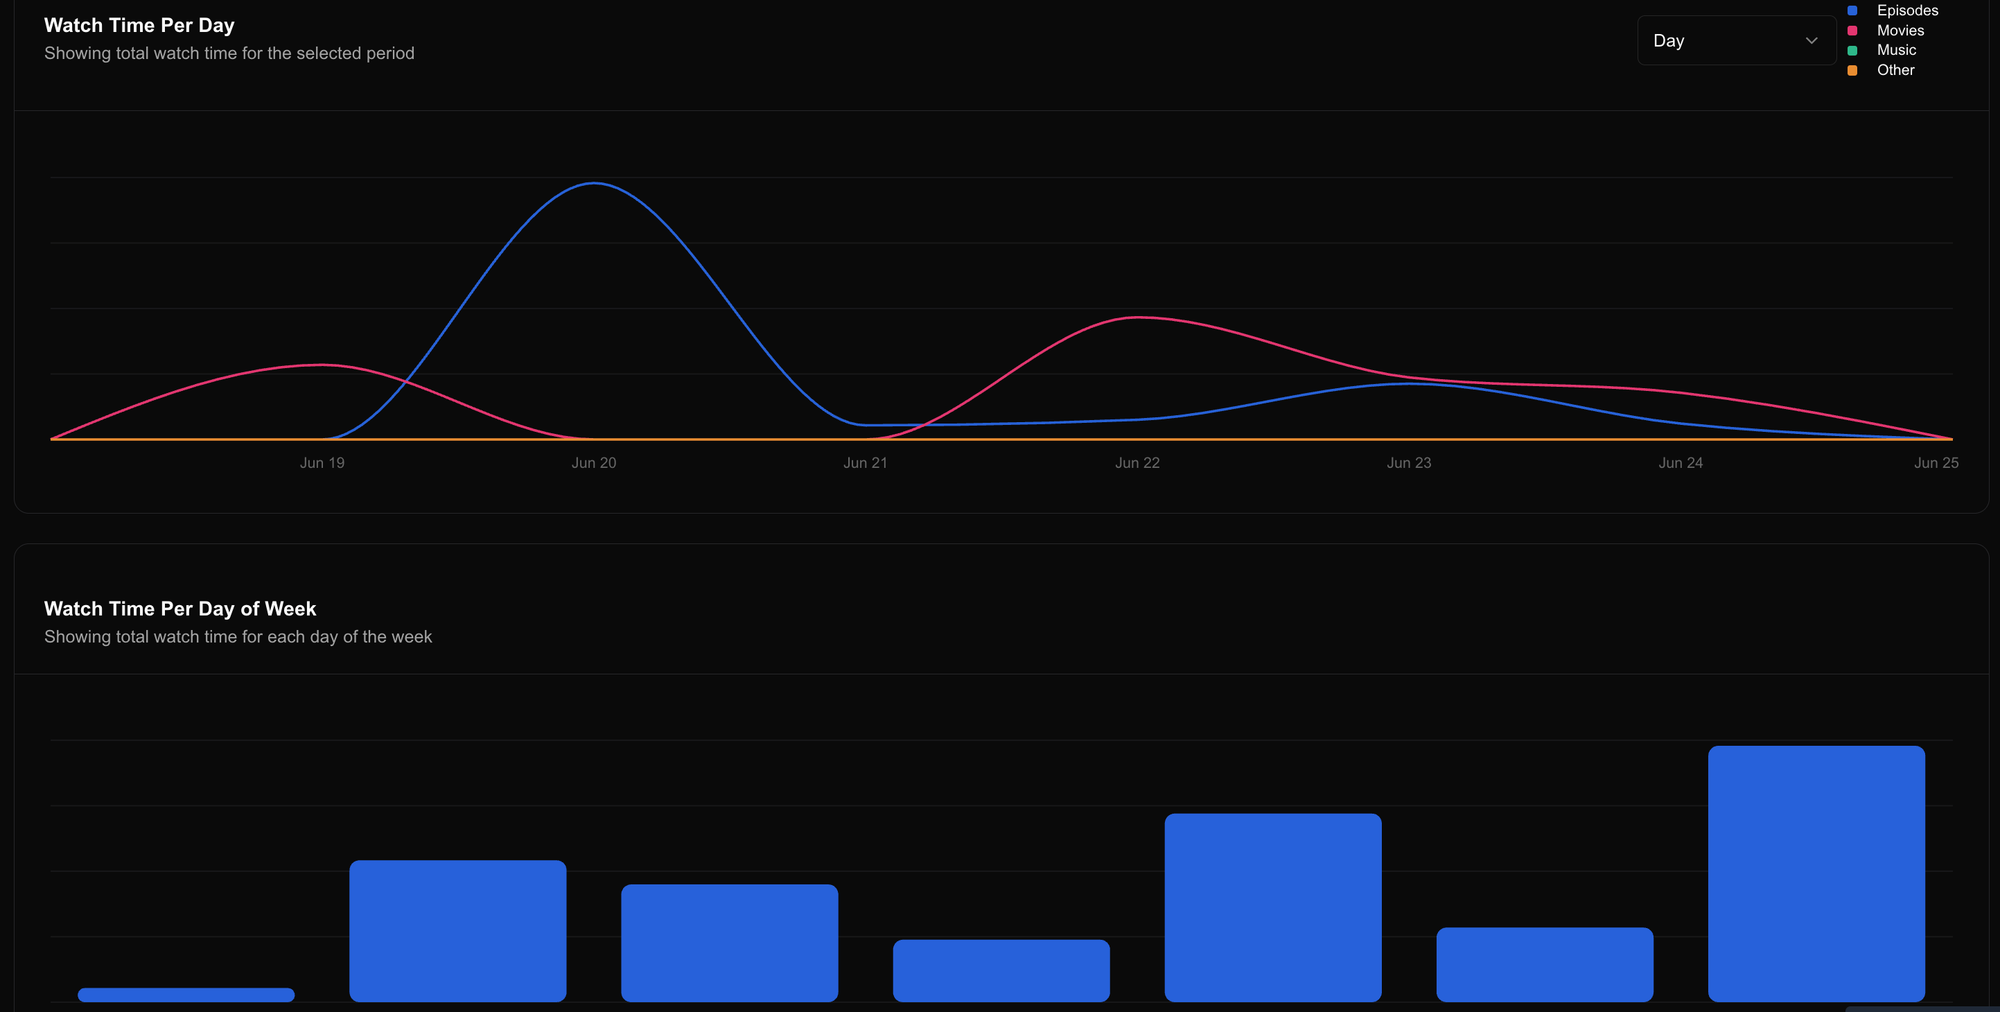
Lots of graphs and charts. See visually when you and your household watch. Monday night at 8pm? There's the spike. Thursday afternoon when the kids are home? Another pattern. Saturday morning movie binges? It's all there in a grid.
Year in Review. Streamystats generates an annual recap of your watching habits. Total hours watched, top shows, top movies, most-watched genres, viewing trends across the year. It's Spotify Wrapped for your media server. You get a moment at the end of the year where you actually see what you spent your time on, quantified and visualized. Tautulli never bothered with this. It was data for data's sake. Streamystats understands that sometimes you want to feel something about your numbers.
These weren't problems Tautulli solved. They're problems you didn't know you had until the tool offered an answer.
The Installation Reality
Streamystats runs via Docker with a setup wizard that walks you through connecting your Jellyfin server, and the first load can take a while depending on library size. I used the Unraid template "Streamystats—AIO," which bundles the frontend and backend together. One template, one configuration, done.
The Docker Compose setup is straightforward. Change your SESSION_SECRET (generate one with openssl rand -hex 64). Point it at your Jellyfin server. Wait for the initial scan to complete. That's it.
The first load took about fifteen minutes with my library size. After that, it runs quiet. The database grows as you watch, but there's no plugin to manage on the Jellyfin side. Streamystats relies solely on the Jellyfin API for statistics, so the playback reporting plugin is no longer needed.
Streamystats and Your Home Screen Workflow
Part 6 covered how Moonfin's native collections support and Moonbase's row reordering let you build a curated home screen without relying on the Home Screen Sections plugin. Streamystats extends that toolkit, but differently depending on which client you use.
If you're on Moonfin, Streamystats isn't directly part of your home screen setup. Instead, you use the Seerr integration, which lives in Moonfin's Integrations menu. From there, you enable and reorder Discovery Rows: Recent Requests, Recently Added, Trending, Popular Movies. These rows pull from your Seerr instance and surface directly on your home screen alongside your automated collections. No Streamystats watchlists involved. This is how you surface curated request activity without a separate collection build job.
If you're on Streamyfin, promoted watchlists work differently. When you create a watchlist in Streamystats and flag it as promoted, those watchlists become available as sections in Streamyfin. You're not just tracking what you've watched; you're creating rows that show up on your phone or tablet. You curate them directly in Streamystats. Mark items as watched or unwatched. Reorder them. Share them across your household. The promoted ones automatically surface alongside your automated collections.
Both approaches serve the same purpose: surfacing specific curated or request-driven content on your home screen without relying on collection build automation. Your Year in Review data stays in Streamystats, but your best-of-the-year watchlist (if you're on Streamyfin) can live as a row on your home screen all year long. For Moonfin users, Seerr's Recent Requests row does something similar, showing what your household has been requesting to watch.
What This Means
Tautulli was observability. It told you what happened. Streamystats is observability with personality. It tells you what happened, suggests what matters, answers the question you were about to ask, and occasionally reminds you of the year you just had.
For me, that's the difference. Tautulli was a tool I opened occasionally to satisfy curiosity. Streamystats is something I check regularly because it keeps showing me things I didn't know I wanted to know. The Year in Review sits somewhere in between. It's not essential infrastructure. It's just fun for end of the year reflection.
Your household watching patterns are more interesting than they seem at first glance. Streamystats makes those patterns visible and occasionally celebratory in a way Tautulli never quite managed. That's not revolutionary. It's just better.
What do you think? Make a free account here and leave a comment below!


Comments